| AutoFEM Analysis Analysis of results | |||||||
| AutoFEM Analysis Analysis of results | |||||||
Results will be shown in the folder Results when the computation ends. The list of default results is tuned as study properties on the page Results or using the context menu in the folder Results in the tree of studies.
Result "Displacement". In all cases of strength analysis, firstly the result Displacements will be analysed. Based on this result, we must assess the accuracy of the setup of boundary conditions (loads and restrictions), i.e. assess first whether the estimated displacements are close to the expected ones in terms of values and directions. Very often, such preliminary analysis of displacements allows for the detection of errors in the task setup or, for instance, the insufficient degree of stabilization of the system in space.

Opening the result “Displacement”
In our case, we can see that the coloured diagram of displacements on the whole matches our expectations. In particular, it is seen that some sheets of the hull coating are not attached to each other and that has caused them to sag. Nevertheless, the displacement diagram generally seems to be adequate enough in this case.
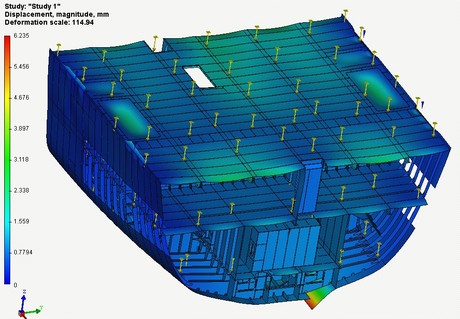
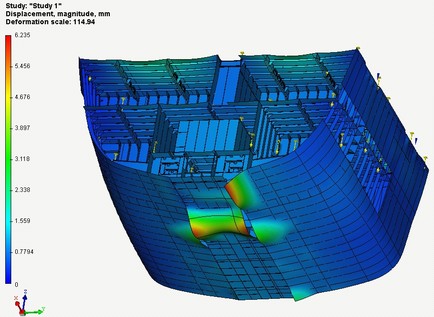
Diagram of the structure displacements
Analysis of the safety factor. Now one may proceed to the estimation of the structure’s strength based on the safety factor. The dialogue is retrieved from the context menu of the diagram, which allows one to choose the criteria of tests for the structure strength. The yield point of the material is used as a default.
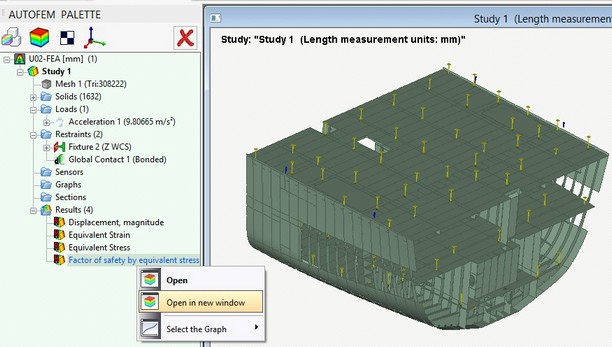
Opening the result “Factor of safety”
On default the safety factor is shown on the log scale in all the range of values. Red zones mean the presence of sectors with the safety factor close to or less than 1 in the structure.
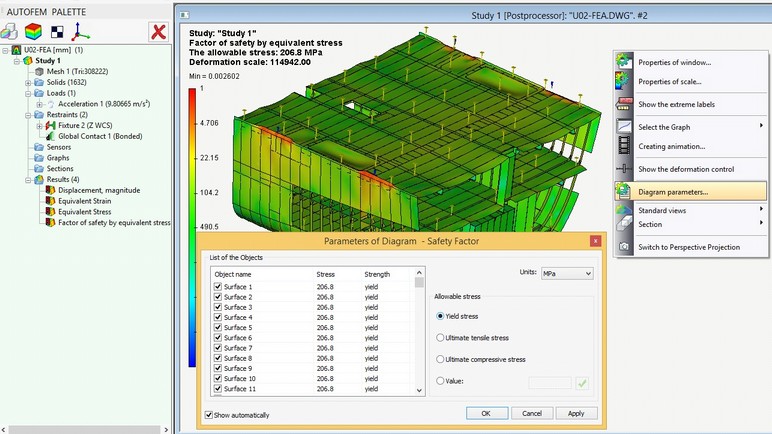
Setups of the imaging of the result “Safety factor”
To ease the search for danger zones, the user can set the upper limit for the safety factor in the setups of the scale, e.g. 50. From this point on, all components of the structure with the safety factor equal to or more than 50 will be marked by solid blue. Let’s analyse the results. We see that the fixtures to the lifting-transporting device are the most stressed zones in the structure, where safety factors have values close to permissible limits.
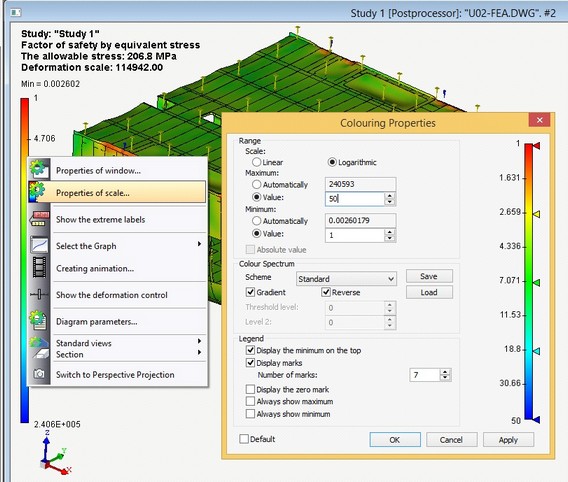
Setup of the scale of result “Safety factor”
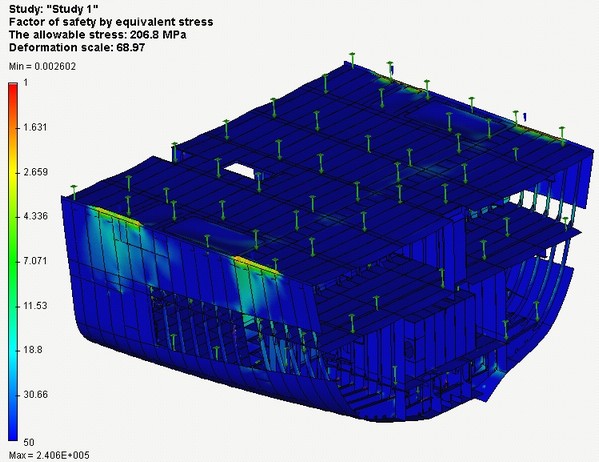
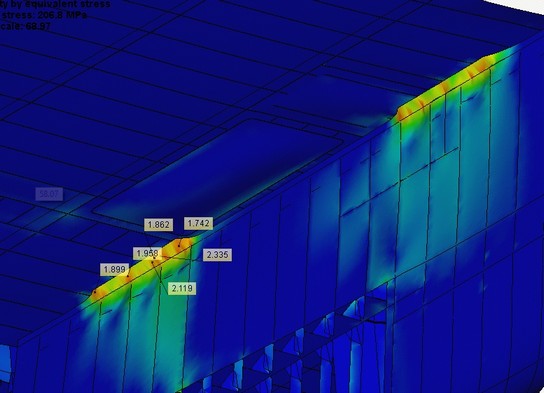
Imaging of the safety factor
Hence, it is desirable that these areas of the structure should be reinforced additionally in order to prevent their irrevocable deformation.
Measurement of reaction forces. The user can measure forces of reaction at the structure’s fixtures.
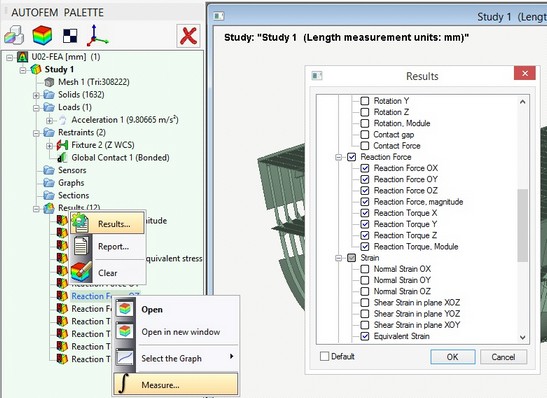
Switching on the result Reaction forces and retrieving of the command Measure
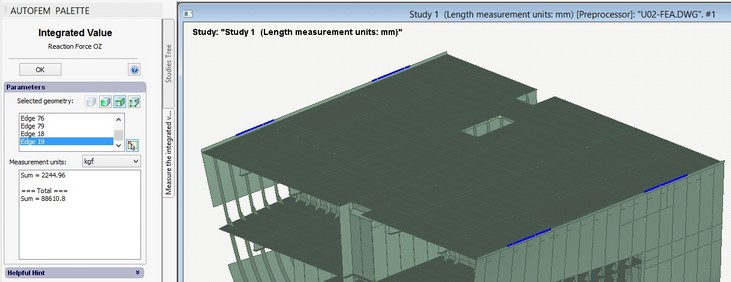
Measuring reaction forces
Report generation. One can generate an independent html-report on the basis of study results.
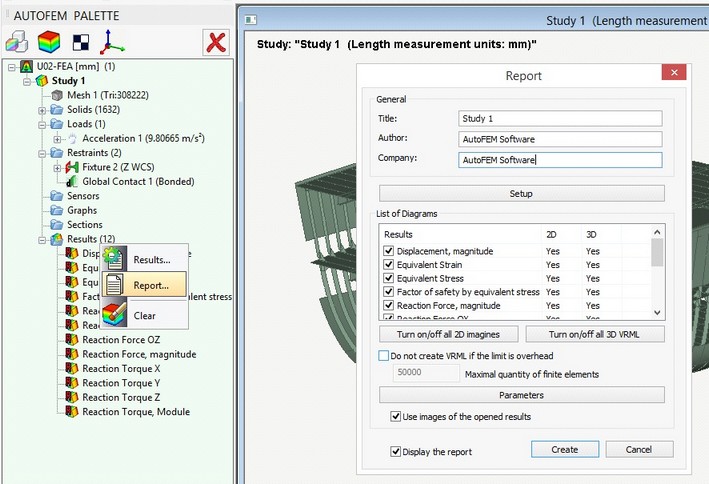
Retrieval of the command of creating a report and report setup dialogue
Animation video. According to results of the study, one can generate a video animating the deformed state of the structure and promoting better understanding of the deformation processes
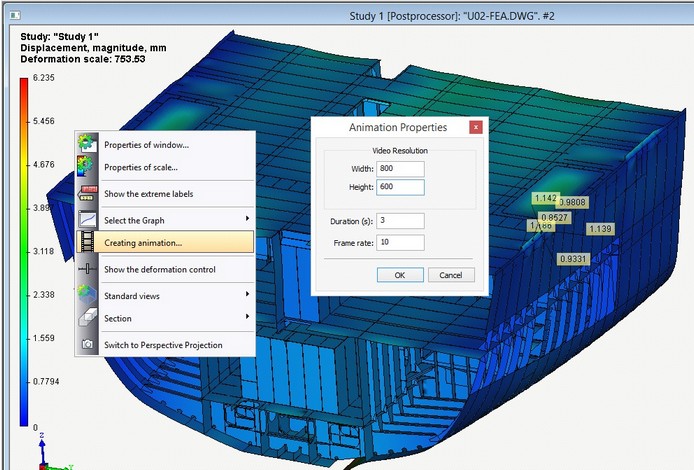
Retrieval of the command creating animation of the result
Conclusion. Thus, with the help of AutoFEM Analysis, we managed to carry out a strength calculation of a whole unit of a vessel, projected in ShipConstructor.