| AutoFEM Analysis Colour Scale Settings | |||||||
| AutoFEM Analysis Colour Scale Settings | |||||||
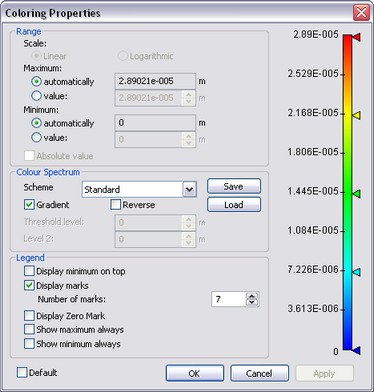
The colour scale settings dialogue can be accessed from the parameters window of the calculation results (the button [Settings]), or from the context menu, accessible in the calculation results window by clicking ![]() . Perform colour scale settings in order to associate the desired colours with the obtained values. The system does the initial setup automatically. It evenly distributes the standard palette (spectrum) of five colours between the maximum and the minimum values obtained in the current calculation.
. Perform colour scale settings in order to associate the desired colours with the obtained values. The system does the initial setup automatically. It evenly distributes the standard palette (spectrum) of five colours between the maximum and the minimum values obtained in the current calculation.
«Range» group of parameters sets parameters of distributing numerical values over the colour scale.
Linear/Logarithmic. The logarithmic scale is used by default for displaying the "Factor of safety" result. This is done in order to get a more detailed colour picture in the most important subrange – where the factor's values are near 1. The user can also switch the display mode to the linear scale for this result. For other results, the linear scale is always used.
Maximum. This interface item serves to set the correspondence between the maximum value and the topmost colour on the scale. By default, the maximum value is set, but the user can enter one's own value of interest in the respective field.
Minimum. This allows defining the correspondence between the minimum value and the bottommost colour on the scale. Otherwise, this interface item is analogous to the previous one.
Absolute Value. Enables the viewing mode of rendering absolute values in the nodes (disregarding the sign). This is an auxiliary mode. It can be used for analysing results in the case when you are interested in the magnitudes of values of displacement components or other measures.
Input of the maximum and minimum values can be used for a custom setup of results rendering. For example, to display the «Factor of safety» result, you can limit the maximum value of the safety factor, in order to achieve a more intuitive result picture in the postprocessor window.
Scale options setup dialogue
«colour spectrum» group of parameters allows adjusting the number of colours in the colour scale.
Scheme. There are seven three predefined settings and one custom.
Standard. This option displays the scale of five main colours.
Gray-scale. This option enables a grayscale display.
Full Spectrum. When using this option, the scale appears as a rainbow of seven main colours.
Besides that, there are the following colour schemes: Maximum, Minimum, Threshold, Range.
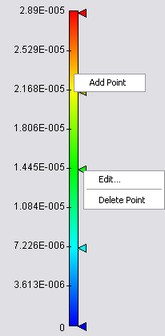
Custom. You can manually set up the colour scale, and then save your choice into a special file for future quick loading (a file with the extension *.col). The setup is performed in the right hand side part of the dialogue, where the colour image of the scale is displayed. On the right of the scale, there are several triangular tags marking places for fixed colours on the scale. Using those tags, you can set a new place for a colour on the scale. To move a tag, depress the ![]() on it and while holding down the button, drag. To create a new tag with a new colour, perform
on it and while holding down the button, drag. To create a new tag with a new colour, perform ![]()
![]() at the right of the scale. A standard Windows dialogue for defining colour will appear. To delete a tag, drag it beyond the colour scale. To change the colour assigned to the respective tag, double-click
at the right of the scale. A standard Windows dialogue for defining colour will appear. To delete a tag, drag it beyond the colour scale. To change the colour assigned to the respective tag, double-click ![]()
![]() . To access this scale settings, you can also use the context menu accessible by right-clicking
. To access this scale settings, you can also use the context menu accessible by right-clicking ![]() on the colour scale image.
on the colour scale image.
Gradient. This flag (enabled by default) serves to set smooth transition from one colour to another in the colour scale.
Invert. Serves to invert the colour scale.
The "Legend" group provides the following controls:
Reverse. This flag reverses the values scale. This mode is used by default when displaying the "Factor of safety" result in the static analysis. This is convenient for displaying critical values that are close to 1, in Red.
Show Marks. When this flag is enabled, the marks with numerical values will be displayed on the colour scale in the results window.
Number of Marks. Sets the number of displayed marks.
Display Zero Mark. Serves to enable the display of the zero value mark on the colour scale.
Always Show Maximum Value. When this flag is enabled, the maximum value string is displayed in the calculation results window.
Always Show Minimum Value. When this flag is enabled, the minimum value string is displayed in the calculation results window.
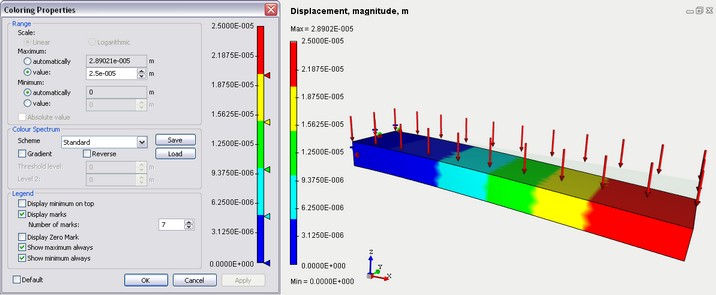
Setting the range of scale values for displaying results
See also: Processing Results