| AutoFEM Analysis S-N Curve | |||||||
| AutoFEM Analysis S-N Curve | |||||||
S-N Curve
S-N curve represents the experimental curve, which is constructed according to the set of experimentally found points. The abscissa Ni of each point is equal to the number of cycles to failure of an experimental specimen, and the ordinate is the fatigue limit for a given number of loading cycles. Fatigue limit is the largest stress which does not cause the destruction of the material. Fatigue limit depends on the cycle asymmetric ratio and denoted σR. Symmetric cycle of loading gives the smallest value of the fatigue limit. Fatigue curve shows the pattern by which the increase of the number of cycles decreases the maximum stress at which the destruction of the material occurs.
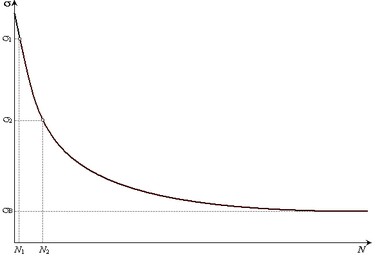
After a certain number of cycles, the fatigue curve ordinates practically cease to vary. In this regard, the number of cycles (in the test material endurance) limits certain threshold, which is called the base number of cycles. If the sample can withstand a basic number of cycles, it is considered that the stress does not exceed the limit of endurance σB.
For the same material can be constructed S-N curves for various cycles of stress: symmetric (R=- 1), pulsating (R= 0), asymmetric.
There are several ways to create the S-N curve of the material in the AutoFEM Fatigue Analysis. S-N curve may be:
| • | selected from the list of predefined curves; |
| • | generated being based on the material properties and a template; |
| • | created manually using the experimental data. |
Generation of the S-N curve of material according with S-N curve for steel.
To generate S-N curve and associate it with the material of the solid, the user has to do the following steps:
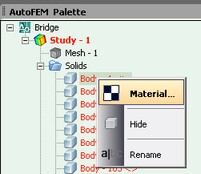
| 1. | Invoke the material properties window, choosing the solid in the service window "AutoFEM Palette" and performing the command "Material..." from the context menu (by pressing |
| 2. | Select the library of materials (into the group "Library"). |
| 3. | Select the material from the list. |
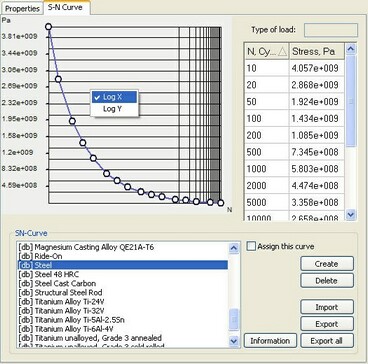
| 4. | Select the page "S-N Curve". |
| 5. | Press |
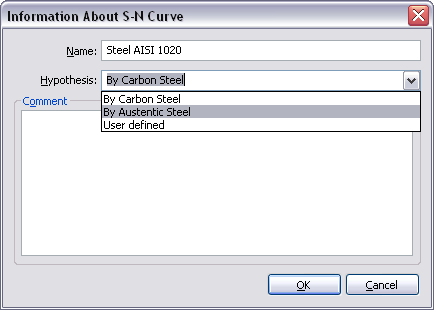
| 6. | Define the parameter "Name" and set the value "By carbon steel" or "By austenitic steel " for the parameter "Hypothesis". |
| 7. | Press |
| 8. | Check the option "Assign this curve". |
| 9. | Press |
The S-N curve is derived as interpolation of the experimental data
To create the S-N curve and associate it with the material of the solid the user has to do the following steps:
| 1. | Invoke the material properties window, choosing the solid in "AutoFEM Palette" and performing the command "Material..." from the context menu (by pressing |
| 2. | Select the library of materials (into the group "Library"). |
| 3. | Select the material from the list. |
| 4. | Select the page "S-N Curve". |
| 5. | Press |
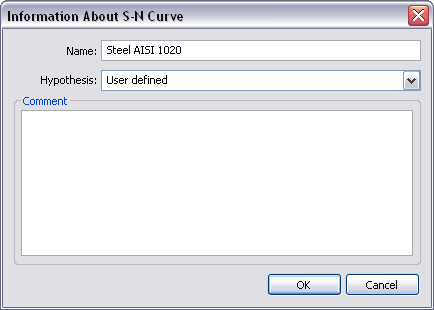
| 6. | Define the parameter "Name" and set the value "User defined" for the parameter "Hypothesis". |
| 7. | Create nodes for S-N curve. |
| 8. | Check the option "Assign this curve". |
| 9. | Press |
Graph of the S-N curve can be stored into an external file (by "Export"), in order, that further it can be used in other fatigue calculations ("Import").
See also: Assigning the Material, Creating New Material, Anisotropic Materials