 |
AutoFEM Analysis Graph, Based on Formula | ||||||
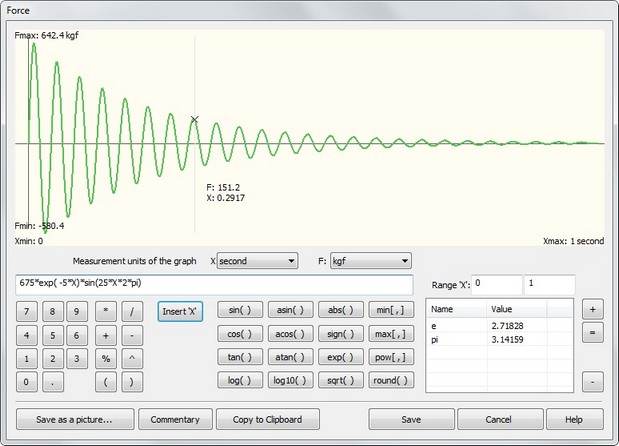
The use of Graph Editor to obtain a graph produced by formula is quite intuitive and similar to the use of a typical scientific calculator. Let us consider a general algorithm on the example of creating a graph according to picture below.

The Graph Editor window
The system allows to create a graph depending on one variable y=f(x).
1. Define a range of "X" variable.![]()
2. Type the formula expression in the the long input field. Use the well-known common rules for mathematical expressions defining, such as "*, /, +, -". Use the number / symbol / function buttons under the input string. To insert a variable argument "X", press the button ![]() (not type a letter "x"). Do not type names of functions such as "sin" or "cos", use function buttons
(not type a letter "x"). Do not type names of functions such as "sin" or "cos", use function buttons ![]() and
and ![]() instead.
instead.
3. If all data have been correctly defined, a graph of the function will be displayed. Press ![]() to finish editing and close the dialogue.
to finish editing and close the dialogue.
See also: Applying Custom Graphs, Graph, Based on Point Set, Graph, Based on Formula, Auxiliary Commands of Graph Editor